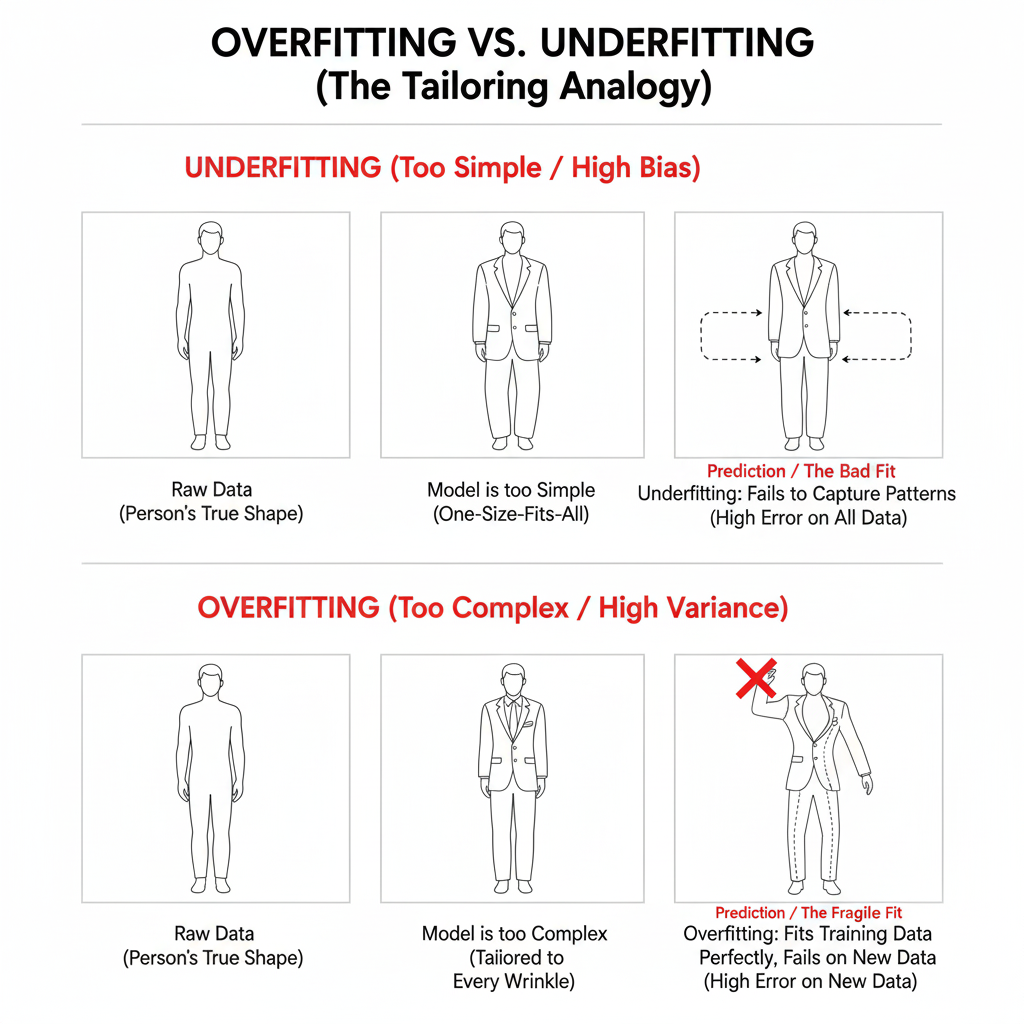
Imagine buying a one-size-fits-all suit — it’s loose and doesn’t match your shape. Similarly, an underfitted model is too simple to capture patterns in data. It performs poorly on both training and testing sets.
Mathematically, it means the error due to bias is high, and the model’s hypothesis h(x) fails to approximate the true function f(x).
Total Error = {Bias}^2 + Variance + Irreducible Error
Underfitting occurs when Bias² dominates.
Now imagine a tailor making a suit that fits every wrinkle — it’s perfect for you, but doesn’t fit anyone else. An overfitted model memorizes training data instead of learning general patterns. It performs very well on training data but fails on unseen (test) data.
Here, Variance is high.
A well-fitted suit perfectly follows your body’s shape without over-detailing. Similarly, a good model generalizes well — it captures true patterns without memorizing noise.
The goal of machine learning is to minimize total error by achieving a balance between bias and variance — the perfect fit.
In technical terms, the concepts of Underfitting, Overfitting, and Good Fit describe how well a machine learning model captures the underlying patterns in data versus random noise. These are central to understanding the Bias-Variance Tradeoff, a fundamental concept in model performance and generalization.
An underfitted model is too simple to represent the data. It assumes a strong prior structure that ignores underlying complexity.
Mathematically, it occurs when the training error and test error are both high.
Error_total = (Bias)^2 + Variance + Irreducible Error
Here, Bias² dominates.
Example:
Using a linear regression model to predict house prices that depend on non-linear factors (like area², location categories). The model oversimplifies relationships, resulting in poor predictions.
An overfitted model learns not only the true relationships but also random fluctuations (noise) in the training data. It performs extremely well on training data but fails to generalize on unseen data — the model has memorized rather than learned.
Mathematically:
Example:
A decision tree that keeps splitting until each leaf contains a single observation. It perfectly fits training data but gives poor predictions on test data.
A good model captures the essential structure in data while ignoring random noise. It minimizes both bias and variance to achieve optimal generalization.
Example:
Ultimately, the goal of any ML model is not to be perfect on training data but to generalize well to unseen data.
Achieving a good fit means reaching the sweet spot between bias and variance — where the model is complex enough to learn patterns but simple enough to ignore noise.
Documented by Harshil Bansal, Team edSlash.
© 2021 edSlash. All Rights Reserved.