Introduction to Exploratory Data Analysis
In the vast and evolving field of data science, Exploratory Data Analysis (EDA) stands out as a critical initial step. It’s the process where data scientists become familiar with data, much like a chef tasting ingredients before cooking a meal. EDA is about understanding patterns, spotting anomalies, and making sense of data before diving into more complex analysis.
Why EDA is a Cornerstone in Data Science
- Data Understanding: EDA is the first step in data analysis, helping data scientists understand the distributions and relationships in the data.
- Insight Generation: It’s crucial for generating insights. EDA techniques like statistical summaries and visualisation help in uncovering the hidden stories in data.
- Data Quality Assessment: EDA is essential for assessing data quality. It helps in identifying missing values, outliers, and errors in the data.
The Process of EDA in Data Science
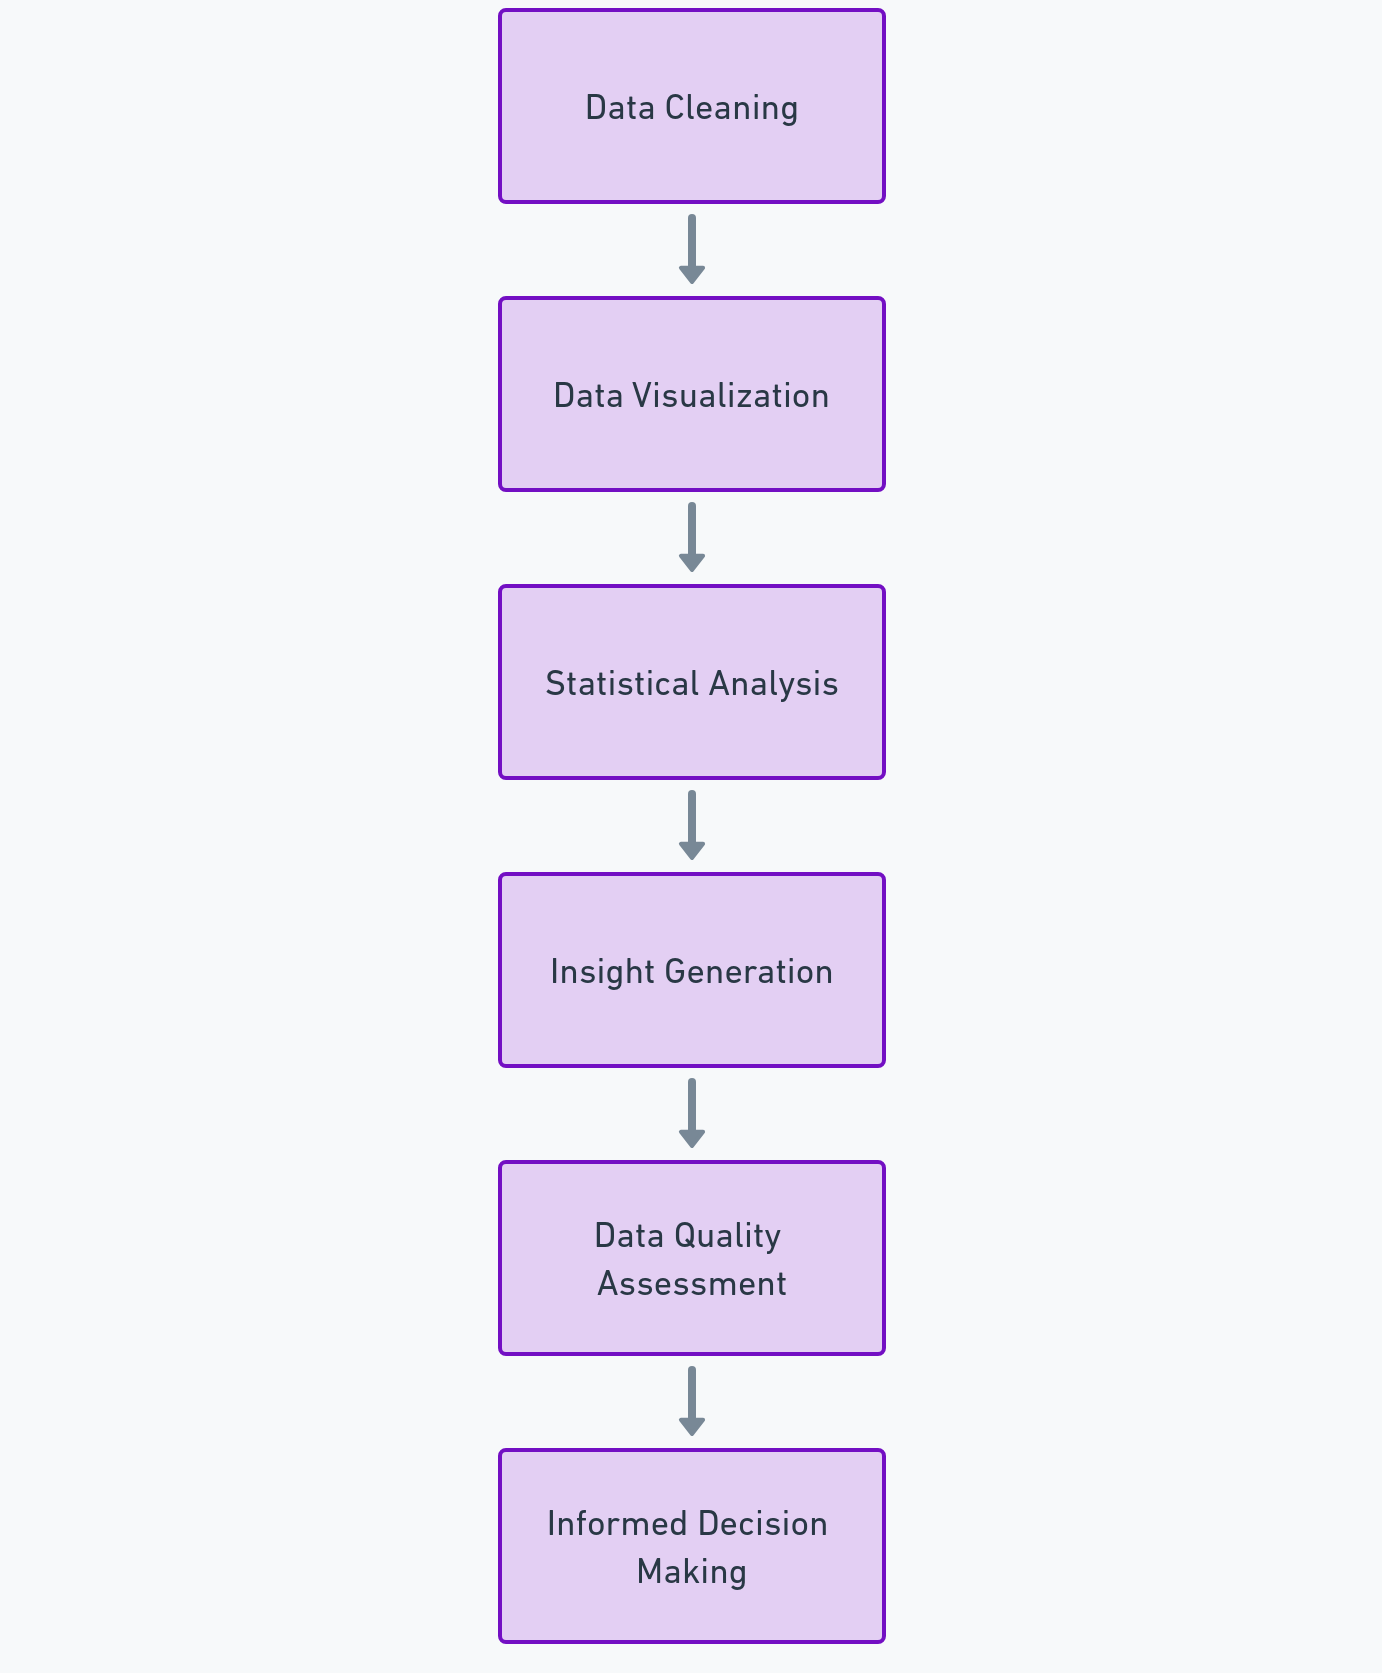
- Data Collection: EDA begins with data collection, which involves gathering the necessary data from various sources.
- Data Cleaning: This step involves cleaning the data by handling missing values and outliers, ensuring the data is accurate and reliable.
- Data Visualisation: Visualisation is a key part of EDA. It includes creating plots and graphs to understand trends, patterns, and outliers.
- Statistical Analysis: This involves applying statistical techniques to summarise the data, like calculating means, medians, and modes.
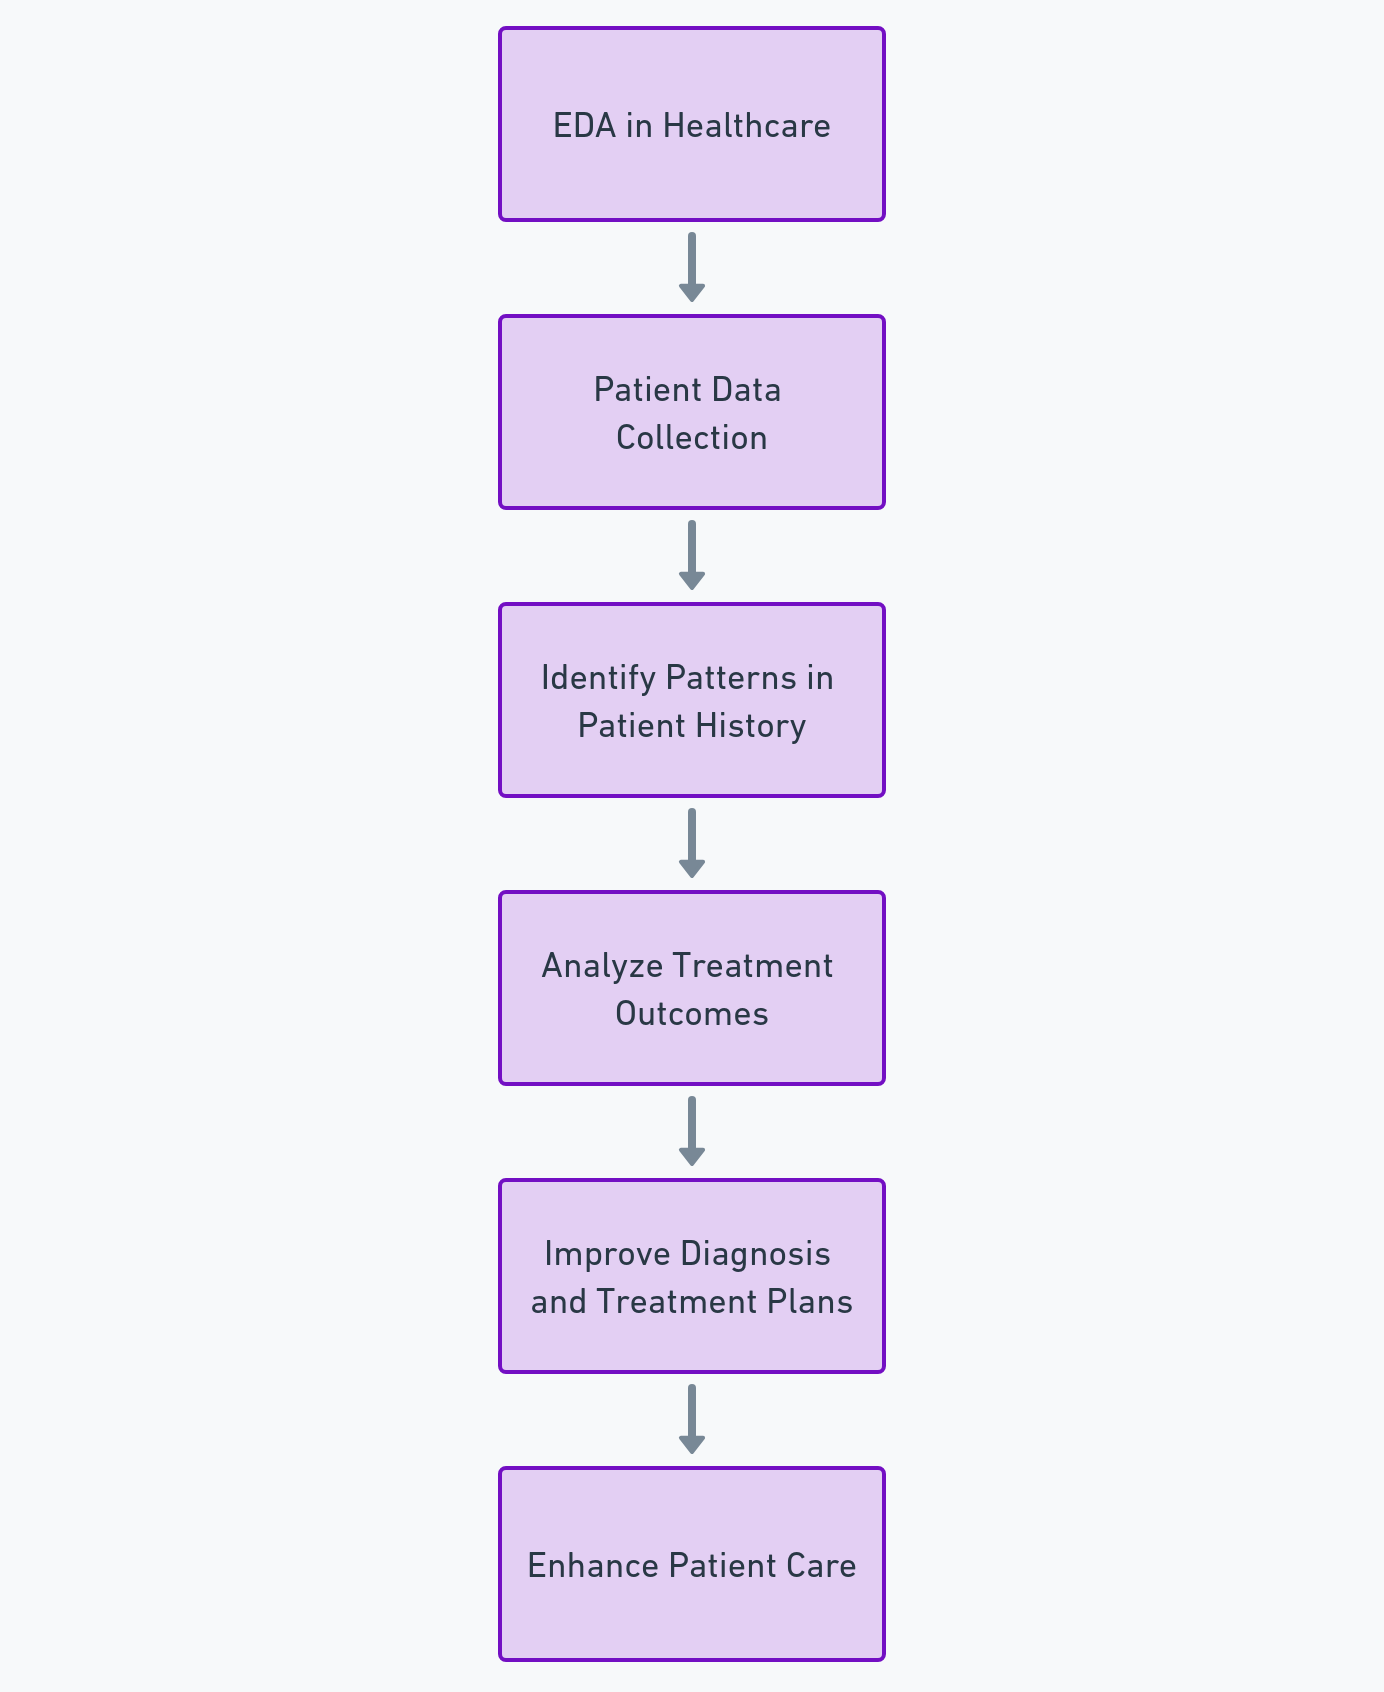
Applications of EDA in Various Industries
- Healthcare: In healthcare, EDA helps in understanding patient data, leading to better diagnosis and treatment plans.
- Finance: In the finance sector, EDA analyses financial data for risk assessment and decision-making.
- Retail: Retail businesses use EDA to understand customer behaviour and preferences, enhancing the customer experience and business strategies.
- Telecommunications: EDA in telecommunications helps analyse call data records to improve network services and customer satisfaction.

EDA Tools and Techniques
Several tools and techniques are used in EDA, including:
- Python and R: These programming languages offer libraries like Pandas, Matplotlib, and ggplot2 for EDA.
- SQL: SQL is used for querying and manipulating data in databases.
- Tableau and Power BI: These tools are used for creating interactive data visualisations.
Challenges and Best Practices in EDA
While EDA is powerful, it comes with challenges like handling large data sets and avoiding biased interpretations. Best practices include:
- Understanding the Business Context: Knowing the business context is crucial for effective EDA.
- Iterative Process: EDA should be an iterative process, where findings lead to more questions and deeper analysis.
- Collaboration: Collaboration with domain experts can provide valuable insights during the EDA process.
The Future of EDA in Data Science
The future of EDA in data science looks promising with advancements in AI and machine learning. Automated EDA tools are emerging, making the process faster and more efficient.
Conclusion
Exploratory Data Analysis is an indispensable part of the data science process. It’s the foundation upon which accurate and insightful data-driven decisions are made. As the field of data science grows, the role of EDA becomes even more significant, shaping the way we understand and interact with data.
Written by Harshil Bansal, Team edSlash.